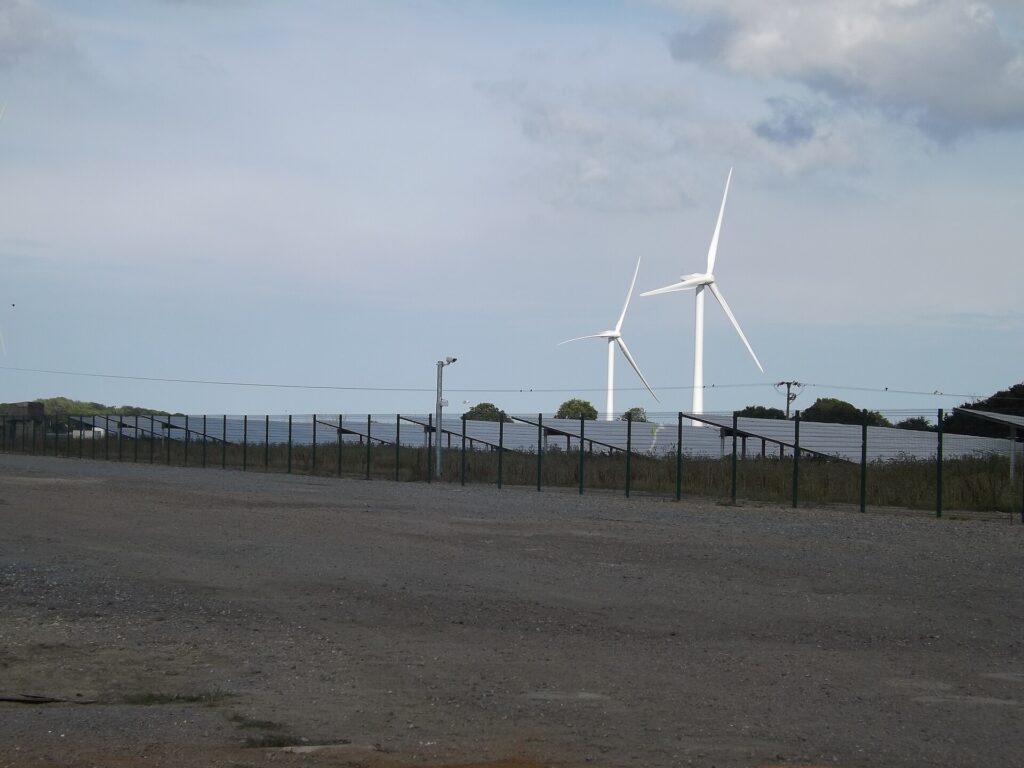

How does solar really compare with wind, hydro, nuclear, natural gas, coal and oil? This page summarizes well known studies on cost, emissions, safety, land and water, with sources so you can check them yourself.
Cost of electricity
The standard yardstick is the levelized cost of energy (LCOE): the lifetime cost of building and running a plant divided by the energy it produces.
- IRENA reports that the global average cost of electricity from new utility scale solar fell by about 90 percent between 2010 and 2023, making it one of the cheapest sources of new power in history.
- Lazard’s annual cost analysis has found for years that new utility scale solar and onshore wind are among the lowest cost sources of new electricity in the United States without subsidies, often below new gas plants.
- Rooftop solar costs more per kWh than large solar farms, but competes with retail electricity prices rather than wholesale prices.
- Solar and wind need storage or other resources to cover nights and calm periods. Adding batteries raises the cost, although solar plus storage is now often competitive with new gas peaking plants.
Life cycle greenhouse gas emissions
These figures include mining, manufacturing, building, operating and decommissioning. They are medians from the Intergovernmental Panel on Climate Change (IPCC), in grams of CO2 equivalent per kWh.
| Source | g CO2e per kWh (median) |
|---|---|
| Coal | 820 |
| Natural gas (combined cycle) | 490 |
| Biomass | 230 |
| Solar PV, utility scale | 48 |
| Solar PV, rooftop | 41 |
| Geothermal | 38 |
| Concentrated solar power | 27 |
| Hydropower | 24 |
| Nuclear | 12 |
| Wind, offshore | 12 |
| Wind, onshore | 11 |
Source: IPCC Fifth Assessment Report, Working Group III, Annex III. Newer studies find lower solar figures as factories use more clean power and panels get more efficient.
Safety: deaths per unit of energy
Counting accidents and air pollution, Our World in Data compiled estimates of deaths per terawatt hour of electricity.
| Source | Deaths per TWh |
|---|---|
| Coal | 24.6 |
| Oil | 18.4 |
| Biomass | 4.6 |
| Natural gas | 2.8 |
| Hydropower | 1.3 |
| Wind | 0.04 |
| Nuclear | 0.03 |
| Solar | 0.02 |
Source: Our World in Data, based on Markandya and Wilkinson (2007) and Sovacool and colleagues (2016).
Land use
Utility solar farms typically use roughly 5 to 10 acres per megawatt, depending on design and tracking. That sounds like a lot, but the land can often be shared with grazing and crops (see Agrivoltaics), and rooftops, parking lots and reservoirs use no new land at all. Coal and gas also use land for mines, wells and pipelines that is rarely counted. Hydro reservoirs can flood very large areas.
Water use
Coal, gas and nuclear plants that use steam turbines withdraw and consume large volumes of water for cooling. Solar PV and wind use almost none during operation, aside from occasional panel cleaning. This matters in drought prone regions from the U.S. Southwest to northern Chile and Mexico.
Reliability and capacity factor
Capacity factor compares real output with running at full power all year. Approximate U.S. values: nuclear over 90 percent, gas combined cycle around 55 to 60 percent, wind around 35 percent, utility solar around 25 percent. Solar’s output is predictable and matches daytime demand, and batteries increasingly shift it into the evening. Grids with lots of solar balance it with storage, hydro, wind, flexible demand and transmission between regions.
Energy payback
Modern panels produce the energy used to make them in roughly one to three years, depending on the sunshine where they are installed, then keep producing for 25 to 30 years or more.
Where each source fits
- Solar: cheap, fast to build, scalable from a phone charger to a gigawatt; needs storage or partners for nights.
- Wind: cheap and often blows at night and in winter, complementing solar.
- Hydro: the backbone of Brazil, Canada, Paraguay and much of Latin America; flexible, but vulnerable to drought.
- Geothermal: steady power in volcanic regions such as Central America and Mexico.
- Nuclear: steady low carbon power; high build costs and long timelines.
- Natural gas: flexible and widely used for balancing; emits CO2 and methane leaks.
- Coal and oil: highest emissions and air pollution; being phased down in most of the Americas.
Key sources for further reading
- IRENA, Renewable Power Generation Costs (annual)
- Lazard, Levelized Cost of Energy+ (annual)
- IPCC Assessment Reports, Working Group III
- Our World in Data, Energy section
- U.S. Energy Information Administration, Electric Power Annual
- National Renewable Energy Laboratory, Life Cycle Assessment Harmonization
- OLADE energy statistics for Latin America and the Caribbean
Discuss this topic
Have a question, a correction, or real world experience to share? Start the conversation below. Replies are reviewed before they appear.